
Observability: What It Actually Means Beyond Adding Some Logs (2026)
Ciphemic Academia Team · 2 Sept 2026 · 7 min read
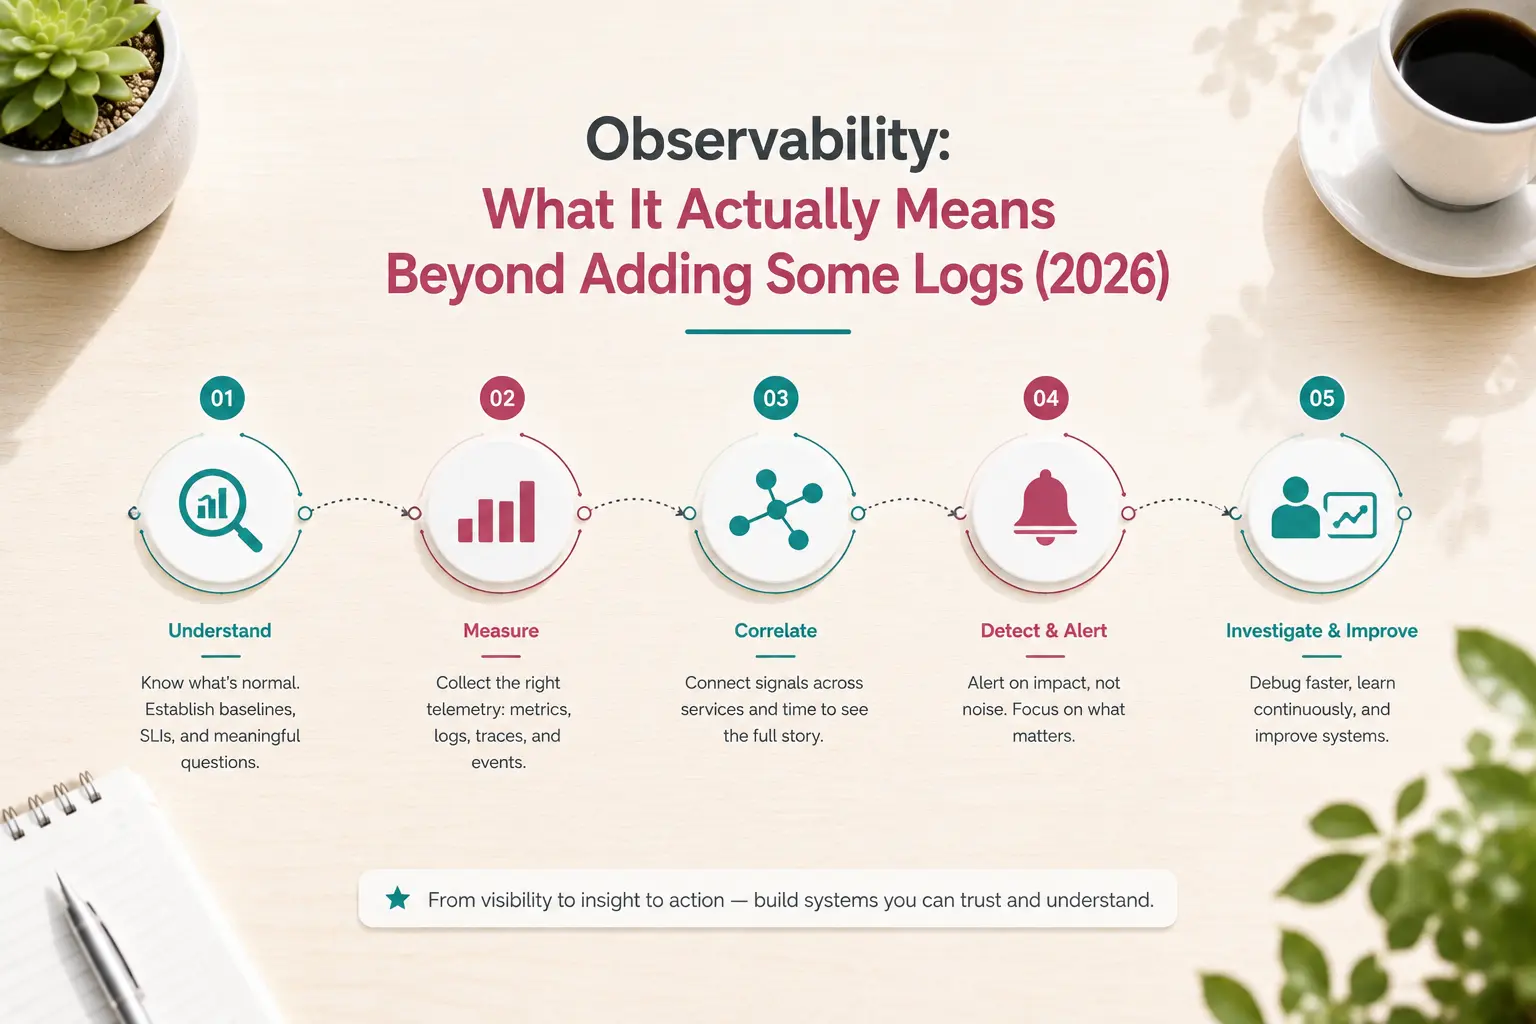
Adding Some Logs Is Not Observability
Nearly every backend project — running on the cloud infrastructure this typically runs on or otherwise — eventually gets a few console.log or print statements scattered through it, usually added reactively while debugging a specific problem. That's not observability — it's the absolute minimum, ad hoc version of it. Real observability means being able to answer "what is my system actually doing right now, and why did it just do that unexpected thing" without needing to guess, redeploy, or add a new log line and wait for the problem to happen again.
This guide covers what observability actually means beyond scattered logging, and the realistic path to building it as a genuine, job-ready skill.
What "Observability" Actually Means
Observability is usually described through three pillars, and understanding what each one actually contributes matters more than memorizing the terms:
- Logs — detailed, timestamped records of specific events, useful for understanding exactly what happened at a particular point
- Metrics — numerical measurements over time (request rate, error rate, latency) that reveal trends and let you catch problems before they become outages
- Traces — following a single request's full journey through a system, especially critical once a system involves multiple services talking to each other
A system with good observability lets you answer "why is this slow" or "why did this fail" using existing data, without adding new instrumentation and waiting for the problem to recur.
Step 1: Structured Logging, Done Properly
Most self-taught developers start with unstructured print statements, and this step is about moving decisively past that:
- Learn structured logging — logs as structured data (typically JSON), not freeform text — so they can actually be searched and filtered systematically
- Understand log levels (debug, info, warn, error) and use them deliberately, not just log everything at the same level
- Practice adding context to logs — request IDs, user IDs where relevant — so a single log line is actually useful on its own, not just in isolation
Step 2: Metrics — Seeing Trends, Not Just Individual Events
Logs tell you about specific events. Metrics tell you about patterns over time, and they're what actually lets you catch a problem developing before it becomes a full outage:
- Learn the core metric types — counters, gauges, histograms — and when each is the right tool
- Instrument a real application with meaningful metrics: request rate, error rate, latency percentiles (not just averages, which hide real problems)
- Learn to build a dashboard that actually surfaces the metrics that matter, not just a wall of every number you could possibly track
- Practice setting up alerts based on metrics — the goal is finding out about a problem from your monitoring, not from a user complaint
Step 3: Distributed Tracing — Following a Request Across Services
This becomes essential once a system involves more than one service, and it's the piece most self-taught developers skip entirely because their early projects are simple enough not to need it:
- Understand what a trace actually captures — a single request's path through multiple services, with timing at each step
- Learn to instrument a multi-service system (even a small one) with tracing, and use it to actually diagnose where time is being spent
- Practice using a trace to answer "which specific step in this request was slow," rather than guessing
- If security is also part of your path, it's worth understanding how observability pairs with a secure pipeline — tracing tends to matter for both reliability and security investigations for the same underlying reason
Step 4: Alerting That Doesn't Train People to Ignore It
Observability data is only useful if the alerts built on top of it are trustworthy. A common, serious mistake is over-alerting until a team learns to ignore notifications entirely:
- Learn to set alert thresholds based on genuinely actionable conditions, not just any deviation from normal
- Understand the difference between a symptom-based alert (users are experiencing errors) and a cause-based alert (a specific internal metric crossed a threshold), and why symptom-based alerts are often more useful
- Practice tuning an alert that's too noisy, and explain what you changed and why
- It's also worth understanding how alerting fits into an automated deployment pipeline, since a bad deploy is one of the most common things a good alert should catch quickly
Step 5: Build One System With Real Observability End to End
The portfolio project that demonstrates this skill isn't scattered print statements — it's a real, deployed application instrumented properly:
- Structured logging with meaningful context throughout
- Real metrics tracked and visualized on a dashboard, including latency percentiles, not just averages
- At least basic tracing if the project involves more than one service
- At least one working, appropriately-tuned alert, with a written note on how you decided the threshold
Realistic Timeline: Basic Logging to Job-Ready Observability Skill
| Phase | Duration | What Happens |
|---|---|---|
| Structured logging | 2–3 weeks | Move from print statements to real, searchable structured logs |
| Metrics and dashboards | 3–4 weeks | Instrument meaningful metrics, build a real, useful dashboard |
| Distributed tracing | 2–4 weeks | Understand and implement tracing across a multi-service system |
| Alerting discipline | 1–2 weeks | Set and tune alerts that are actionable, not just noisy |
| One complete instrumented project | 3–4 weeks | Build and document one system with real observability throughout |
| Total realistic timeline | 2–4 months | From scattered print statements to genuine, demonstrable observability skill |
Common Mistakes People Make With Observability
- Treating scattered, unstructured print statements as sufficient observability
- Tracking metric averages instead of percentiles, which hides the worst real user experiences
- Building dashboards with every possible metric instead of the ones that actually matter
- Setting up alerts that fire too often, training the team to ignore them
- Only thinking about observability after a serious production incident, rather than building it in from the start
Frequently Asked Questions
Is observability only relevant for large-scale, distributed systems?
No — even a single-service application benefits significantly from structured logging and basic metrics. Distributed tracing specifically becomes essential once multiple services are involved, but logging and metrics discipline is valuable at any scale.
What's the real difference between monitoring and observability?
Monitoring typically refers to watching predefined metrics and alerts for known failure conditions. Observability is broader — it's about having enough data (logs, metrics, traces) to investigate and understand new, previously unanticipated problems, not just the ones you thought to monitor for in advance.
Do I need to learn a specific observability tool, or are the concepts more important?
The underlying concepts — structured logging, meaningful metrics, tracing, sensible alerting — transfer across specific tools, so understanding the concepts deeply matters more than mastering one particular platform. That said, hands-on experience with at least one real, industry-common tool is valuable for demonstrating the skill practically.
Why do experienced engineers care so much about observability specifically?
Because the alternative — debugging a production issue with no structured data, guessing based on scattered logs, and adding new instrumentation while an outage is actively happening — is genuinely one of the worst, most stressful parts of the job. Good observability is what turns a stressful, uncertain incident into a solvable problem with a clear path to the answer.
Start Building
Reading about metrics and tracing doesn't build the instinct for either — instrumenting a real system and actually using that data to diagnose a real problem does. The Observability roadmap on Ciphemic Academia is built around exactly this: knowing what your system is doing before a user has to tell you.
Pick a roadmap, start building, and move past scattered print statements into knowing what your system is actually doing.
Building along with this?
Join the Ciphemic Academia Discord — share what you're working on, get unstuck, and see what others are building.